Asheville City Schools General Demographics
Asheville City Schools Demographics (White & Black)
Sources
- NC Department of public instruction
Data, videos, and more
Early Childhood Education
Early Childhood Education
- During the 2011 - 12 school year, Asheville City Schools provided preschool education to 140 students, of which 58.6% were black, 9.3% were Hispanic, and 30.7% were white.
Sources
- U.S. Department of Education Office for Civil Rights https://ocrdata.ed.gov/Page?t=d&eid=29089&syk=6&pid=918
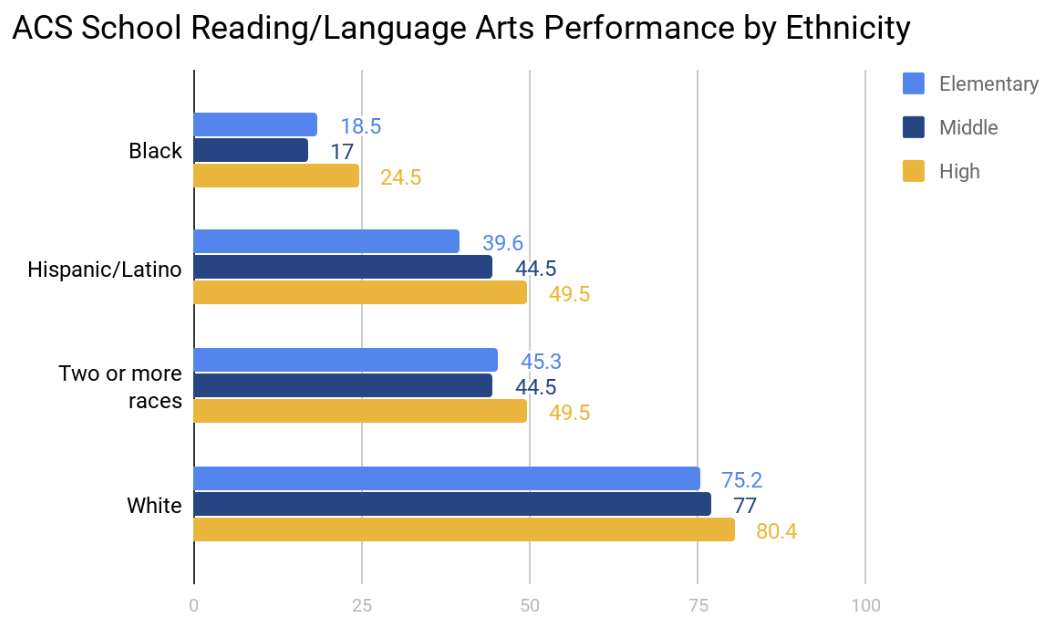
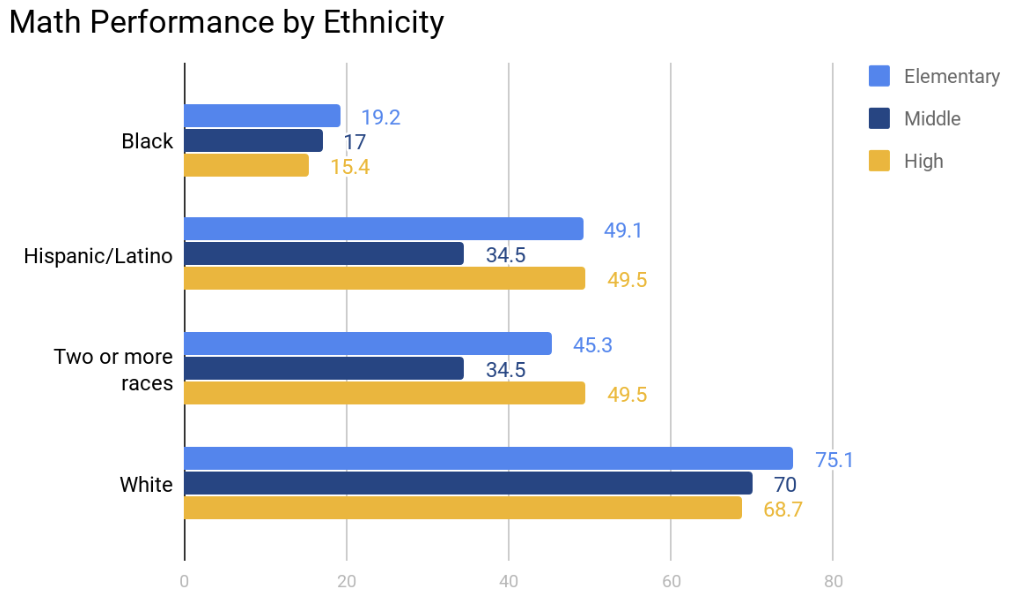
End of Grade Proficiency Scores for ACS Grades 5-8
- By Race
- By Race and Gender
- Reports still needed
Sources
- The North Carolina Department of Public Instruction http://www.ncpublicschools.org/accountability/reporting/leaperformancearchive/
Sources
- The North Carolina Department of Public Instruction http://www.ncpublicschools.org/accountability/reporting/leaperformancearchive/
Sources
- The North Carolina Department of Public Instruction http://www.ncpublicschools.org/accountability/reporting/leaperformancearchive
- Data Source Spreadsheet https://docs.google.com/spreadsheets/d/1_E6oD3N3C4v-P-z8ZQPCfd_J-WPqUIWwL1JB9Gn-Sww/edit#gid=417637011
End of Course Proficiency
- By Race
- By Race and Gender
Sources
This content needs a source. If you know where it came from and can provide further details, please help us source this content.
Sources
This content needs a source. If you know where it came from and can provide further details, please help us source this content.
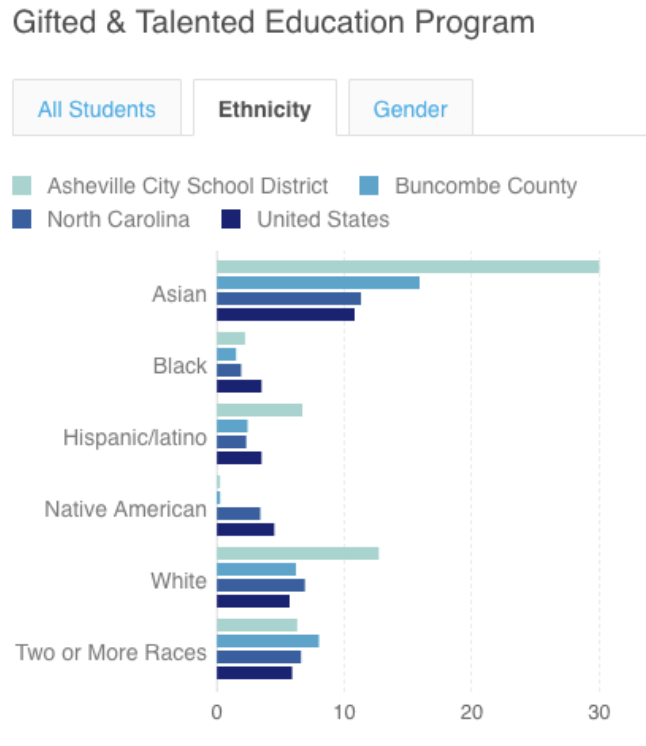
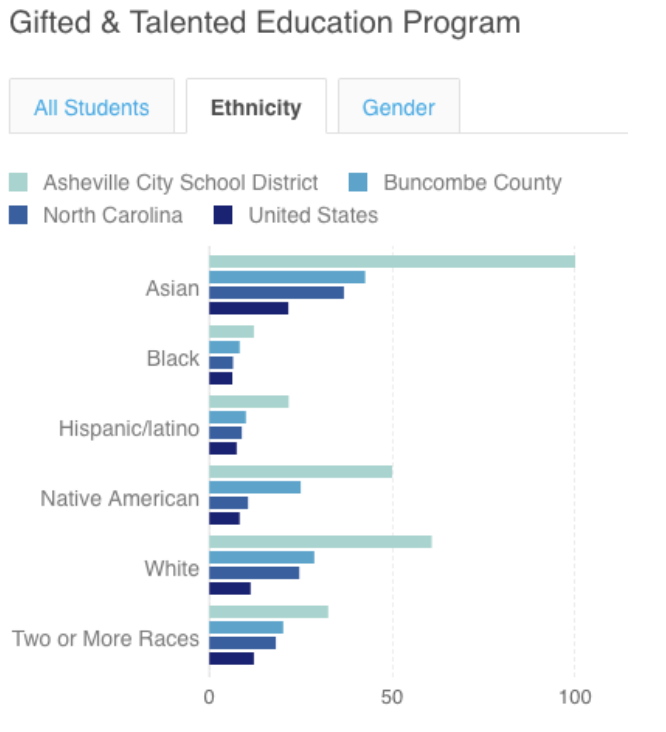
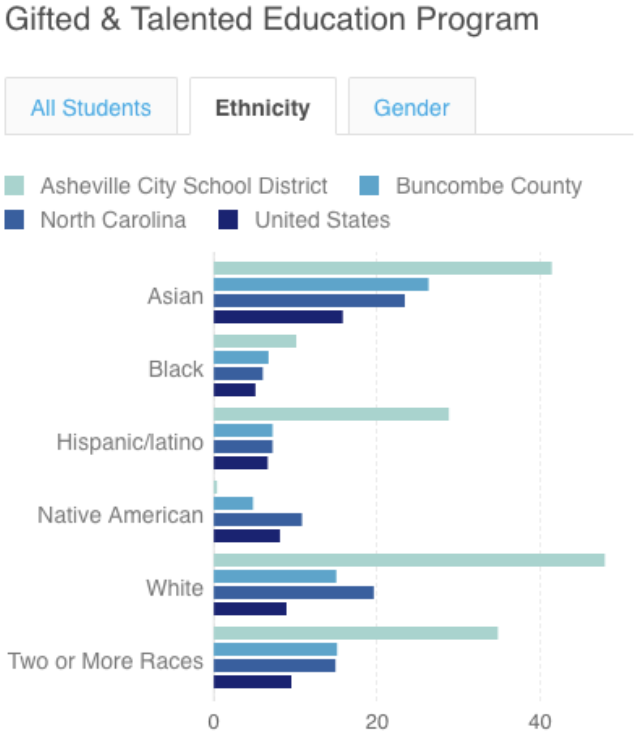
Gifted and Talented (Elementary and Middle School)
- Gifted and Talented (Elementary and Middle School)
Sources
This content needs a source. If you know where it came from and can provide further details, please help us source this content.
Sources
This content needs a source. If you know where it came from and can provide further details, please help us source this content.
Sources
This content needs a source. If you know where it came from and can provide further details, please help us source this content.
AP/Honors (High School)
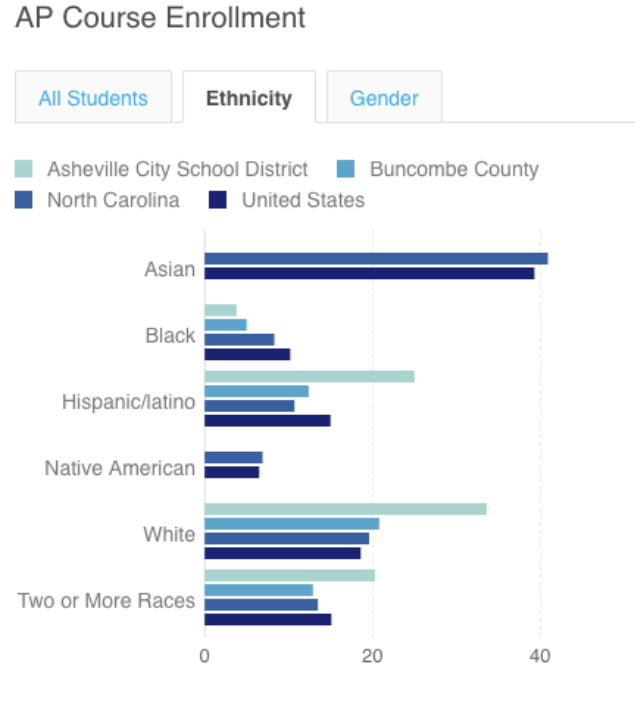
Sources
This content needs a source. If you know where it came from and can provide further details, please help us source this content.
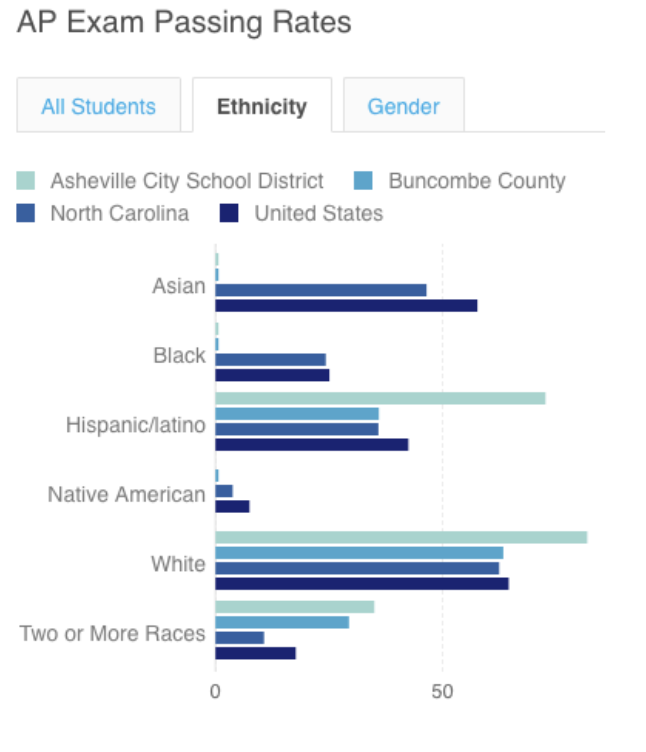
Sources
This content needs a source. If you know where it came from and can provide further details, please help us source this content.
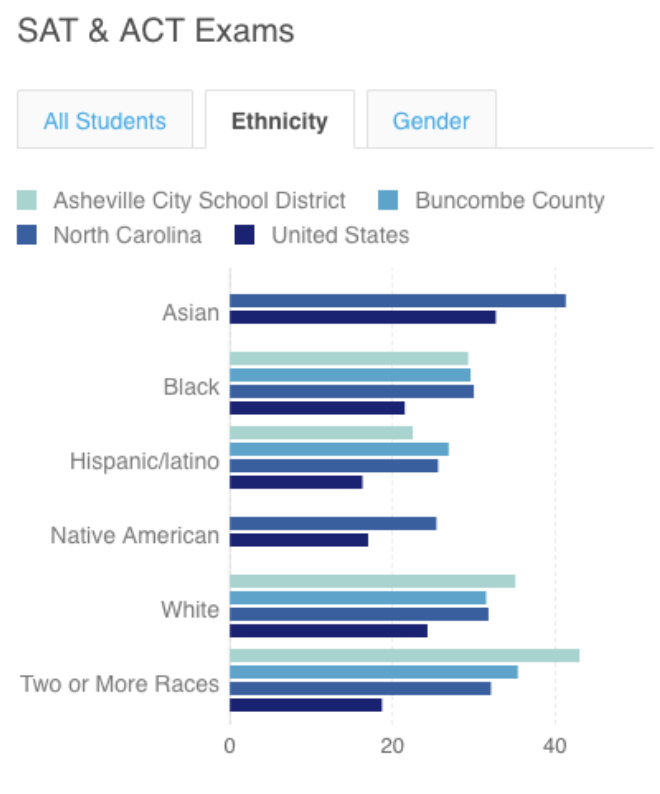
Sources
This content needs a source. If you know where it came from and can provide further details, please help us source this content.
Learning Disabilities
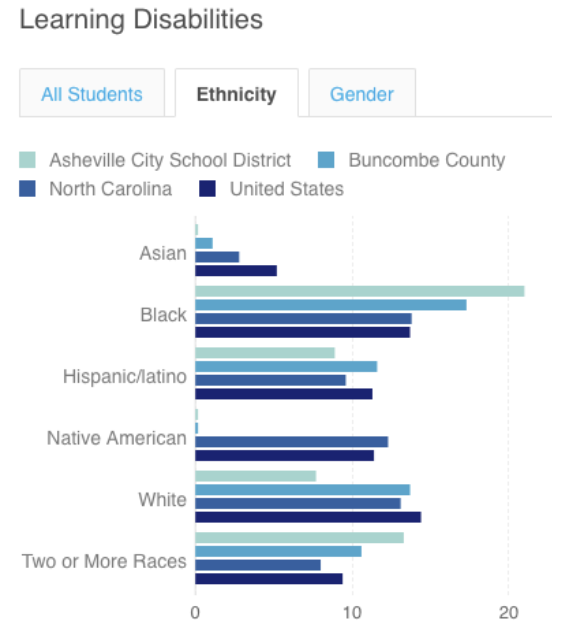
Sources
This content needs a source. If you know where it came from and can provide further details, please help us source this content.
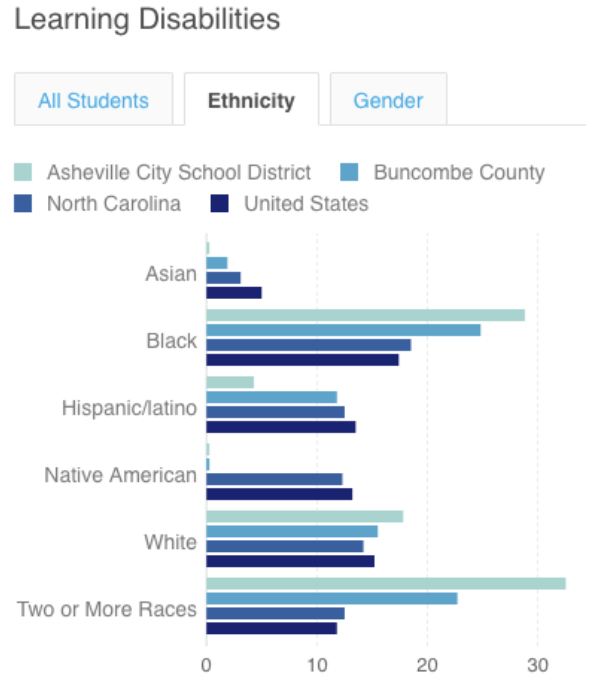
Sources
This content needs a source. If you know where it came from and can provide further details, please help us source this content.
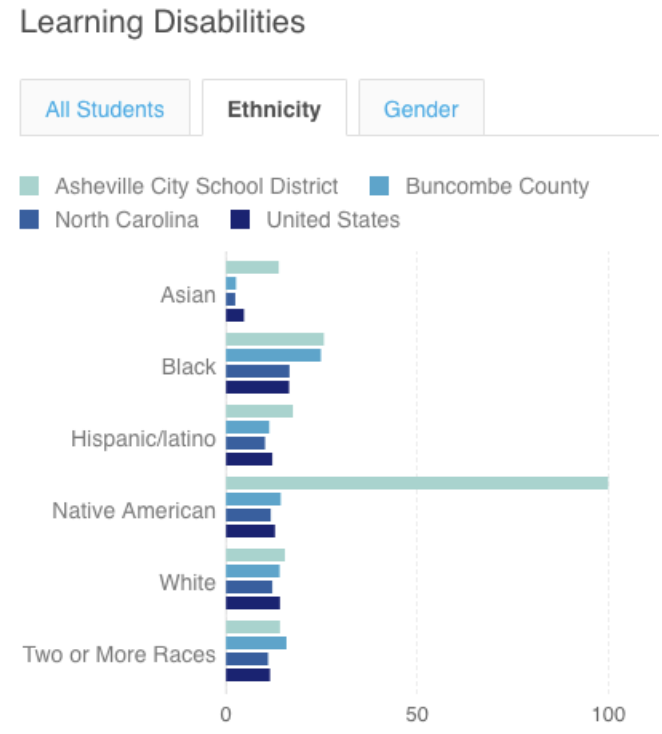
Sources
This content needs a source. If you know where it came from and can provide further details, please help us source this content.
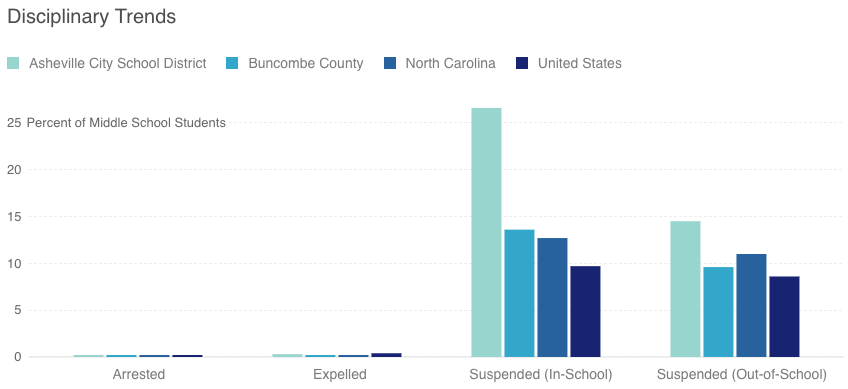
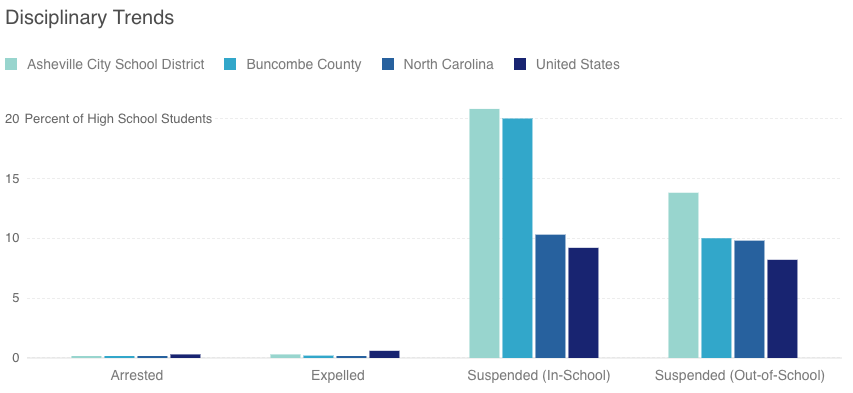
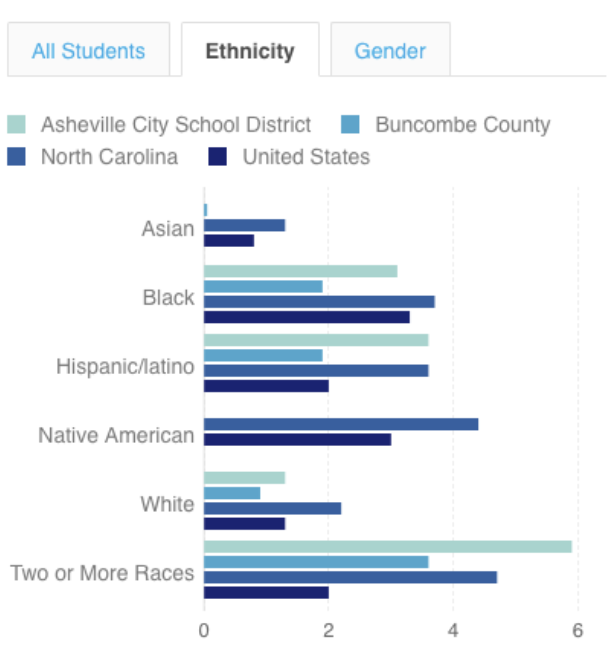
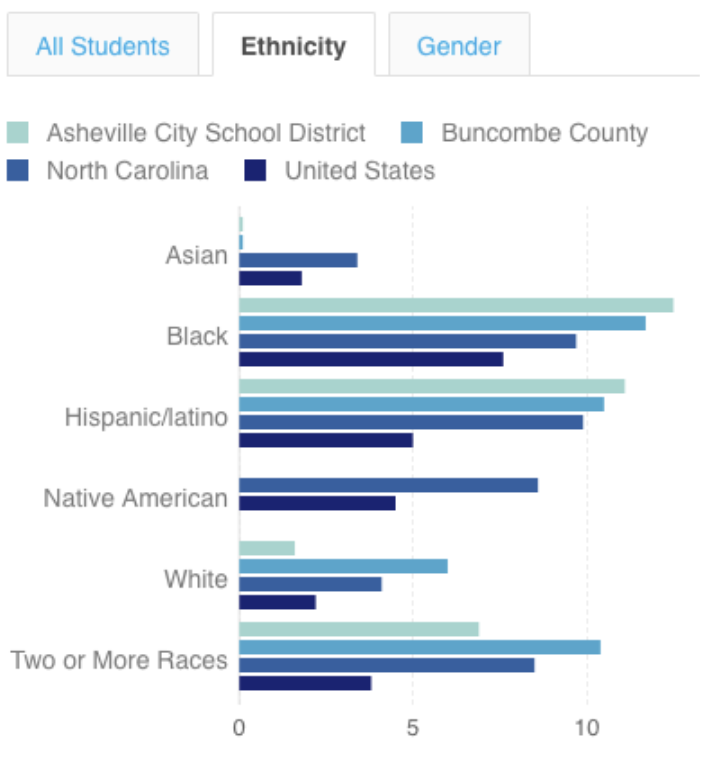
Out-of-School Suspensions and Expulsions
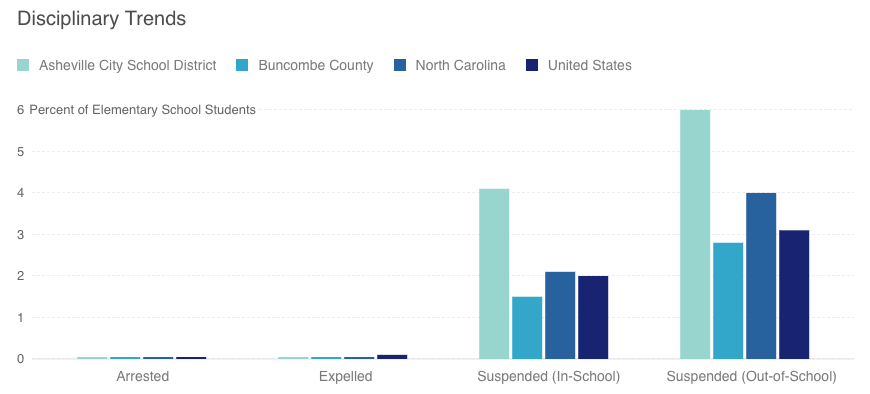
Sources
This content needs a source. If you know where it came from and can provide further details, please help us source this content.
Sources
This content needs a source. If you know where it came from and can provide further details, please help us source this content.
Did you know?
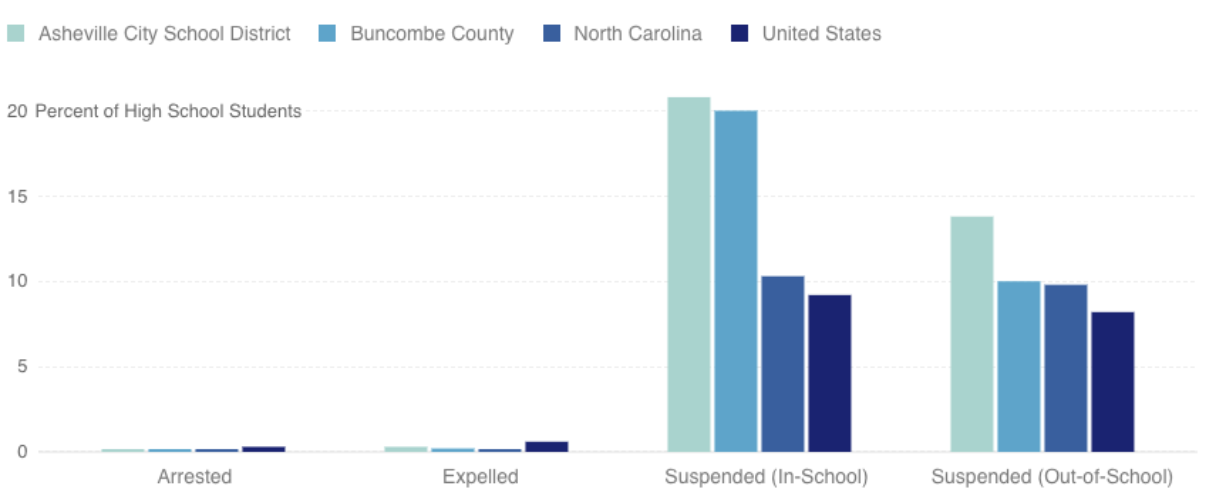
Suspensions and Expulsions (2011)
Sources
- U.S. Department of Education Office for Civil Rights https://ocrdata.ed.gov/Page?t=d&eid=29089&syk=6&pid=887
Participation in Incentive Programs by Race and Gender
- Special occasions where behavior or academic conduct enables eligibility
Dropout Rates for Middle School and High School
2011 – 2017 Number of dropouts Asheville City Schools by ethnicity (White & Black)
Sources
- NC Department of Instruction http://www.ncdpi.wikispaces.net/
Retention Rates by Race and Gender for Middle School and High School
Sources
This content needs a source. If you know where it came from and can provide further details, please help us source this content.
Sources
This content needs a source. If you know where it came from and can provide further details, please help us source this content.
Sources
This content needs a source. If you know where it came from and can provide further details, please help us source this content.
4-year
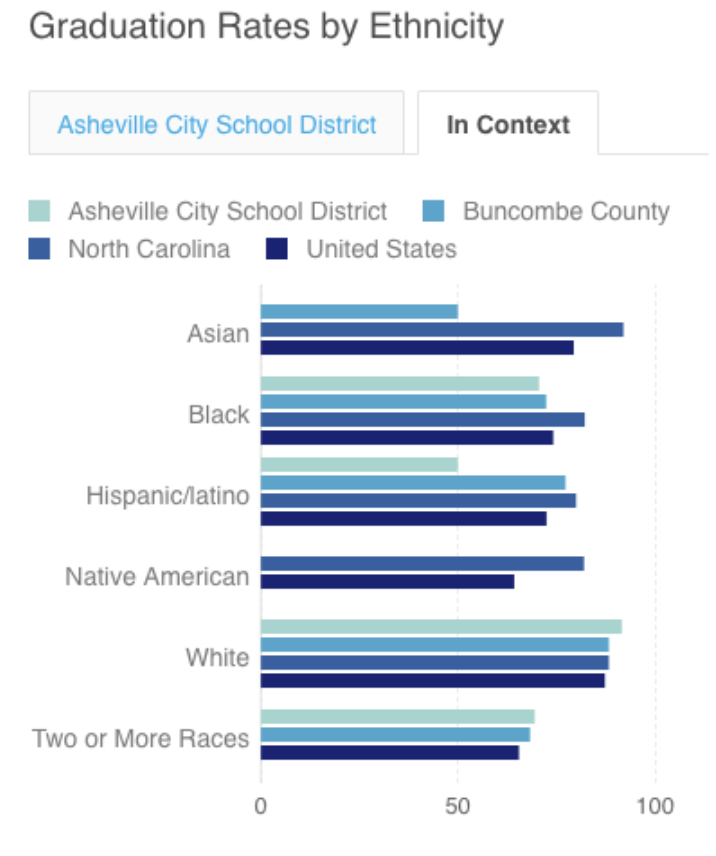
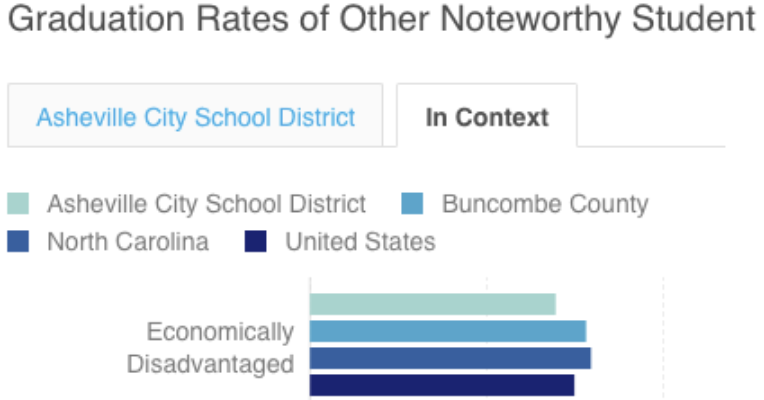
2016 Graduation rates by ethnicity — ACS, BCS, NC, US
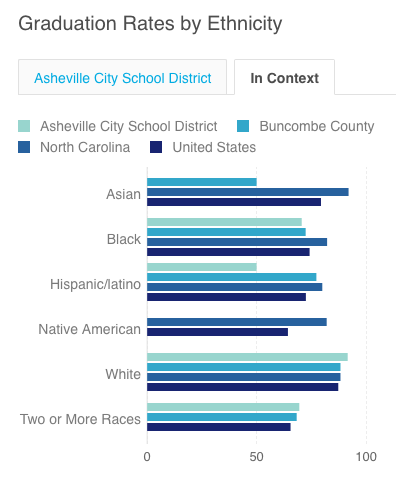
Sources
- Schoolwires.net https://nc02214494.schoolwires.net/Page/380
2016 Graduation rates by Ethnicity ACS
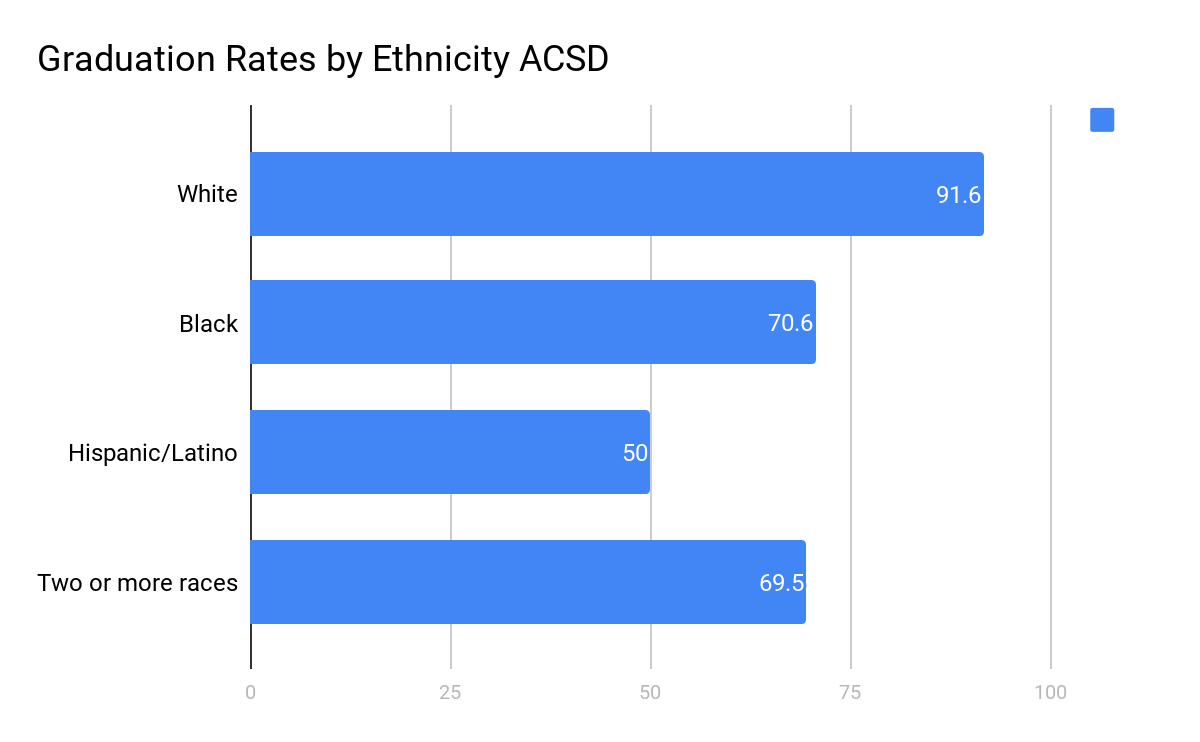
Sources
- Schoolwires.net https://nc02214494.schoolwires.net/Page/380
Sources
This content needs a source. If you know where it came from and can provide further details, please help us source this content.
Sources
This content needs a source. If you know where it came from and can provide further details, please help us source this content.