Archives: Visualizations
We believe that interactive data has the power to engage the community and create positive change. Our goal is to bring research to the public in a way that can help people understand the numbers and make their own contributions.
Sources
This content needs a source. If you know where it came from and can provide further details, please help us source this content.
Sources
This content needs a source. If you know where it came from and can provide further details, please help us source this content.
Sources
This content needs a source. If you know where it came from and can provide further details, please help us source this content.
Sources
This content needs a source. If you know where it came from and can provide further details, please help us source this content.
Sources
This content needs a source. If you know where it came from and can provide further details, please help us source this content.
Sources
This content needs a source. If you know where it came from and can provide further details, please help us source this content.
Sources
This content needs a source. If you know where it came from and can provide further details, please help us source this content.
Sources
This content needs a source. If you know where it came from and can provide further details, please help us source this content.
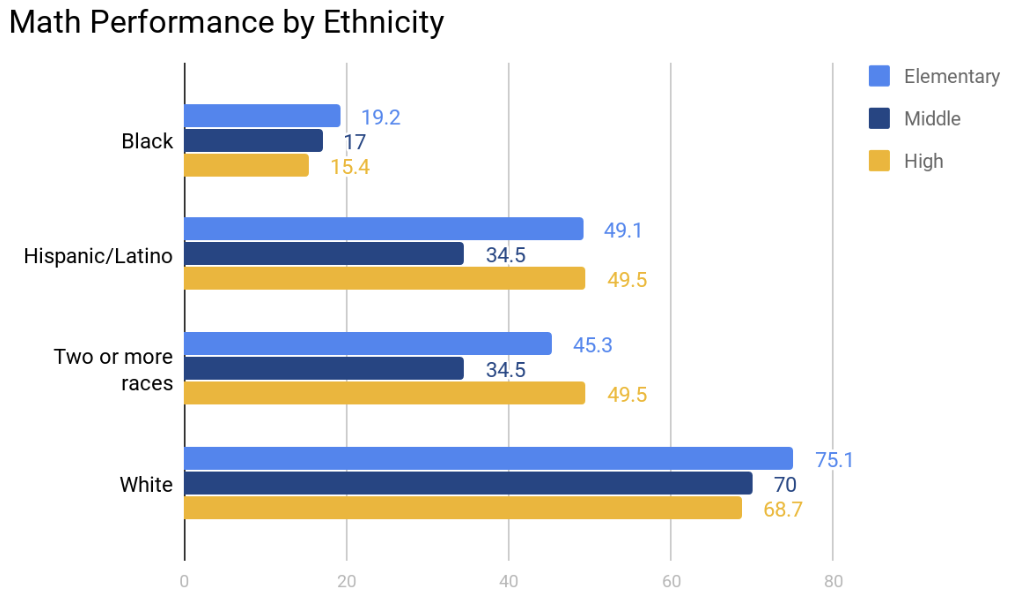
2016-2017 School Year, ACS, End of Course Results (MT)
- 1188 students given End of Course exams
- 68.2% Grade level proficient
- Of the above
- 256 Black students tested
- 28.9% GLP (74)
- 755 White students tested
- 82.6% GLP (624)
- 96 Hispanic students tested
- 61.5% GLP (59)
- 256 Black students tested
2016-2017 race and gender by school – NC Department of public instruction (MT)
Scroll right to see additional data
| Sch | total | Whi | W-m | W-F | Bla | B-m | B-f | His | H-m | H-f | 2+ | 2+-m | 2+-f |
| All ACS | 4504 | 60.6% 2730 |
30.2% 1360 |
30.4% 1370 |
22.4% 1010 |
11.5% 517 |
10.9% 493 |
8.4% 380 |
4.1% 184 |
4.4% 196 |
6.9% 310 |
3.5% 158 |
3.4% 152 |
| AHS | 22.7% 1021 |
61.7% 630 |
30% 306 |
31.7% 324 |
23.5% 240 |
11.8% 120 |
11.8% 120 |
7.2% 74 |
4.5% 46 |
2.7% 28 |
6.2% 63 |
2.5% 26 |
3.6% 37 |
| SILSA | 7.8% 351 |
66.4% 233 |
29.3% 103 |
37% 130 |
17.9% 63 |
7.7% 27 |
10.3% 36 |
8.8% 31 |
3.4% 12 |
5.4% 19 |
4.8% 17 |
1.4% 5 |
3.4% 12 |
| AMS | 17.7% 796 |
59.7% 475 |
31.3% 249 |
28.4% 226 |
22% 175 |
11.1% 88 |
10.9% 87 |
9.5% 76 |
5.4% 43 |
4.1% 33 |
7.2% 57 |
4% 32 |
3.1% 25 |
| Hall Fl Elem | 7.7% 347 |
45% 156 |
23.3% 81 |
21.6% 75 |
32% 111 |
18.7% 65 |
13.3% 46 |
11% 38 |
3.2% 11 |
7.8% 27 |
11.5% 40 |
6.6% 23 |
4.9% 17 |
| Isa Dix | 11.7% 525 |
62.1% 326 |
27.2% 143 |
34.9% 183 |
20.2% 106 |
10.7% 56 |
9.5% 50 |
8.8% 46 |
4.4% 23 |
4.4% 23 |
7.4% 39 |
5.7% 30 |
1.7% 9 |
| Clax Elem |
10.9% 493 |
62.5% 308 |
31.8% 157 |
30.6% 151 |
22.9% 113 |
11.4% 56 |
11.6% 57 |
5.9% 29 |
1.8% 9 |
4.1% 20 |
7.7% 38 |
3.2% 16 |
4.5% 22 |
| Jones Elem |
11.1% 501 |
62.5% 313 |
35.1% 176 |
27.3% 137 |
23.6% 118 |
10.6% 53 |
13% 65 |
5.6% 28 |
2.4% 12 |
3.2% 16 |
5.8% 29 |
2.6% 13 |
3.2% 16 |
| Vance Elem |
10.4% 470 |
61.5% 289 |
30.9% 145 |
30.6% 144 |
17.9% 84 |
11.1% 52 |
6.8% 32 |
12.3% 58 |
6% 28 |
6.4% 30 |
5.7% 27 |
2.8% 13 |
3% 14 |
|
Elementary Schools
|
|||||||||||||
| Sch | total | Whi | W-m | W-F | Bla | B-m | B-f | His | H-m | H-f | 2+ | 2+-m | 2+-f |
| All Elem | 2336 | 59.6% 1392 |
22.8% 532 |
8.5% 199 |
7.4% 173 |
||||||||
| Hall Fl Elem | 7.7% 347 |
45% 156 |
23.3% 81 |
21.6% 75 |
32% 111 |
18.7% 65 |
13.3% 46 |
11% 38 |
3.2% 11 |
7.8% 27 |
11.5% 40 |
6.6% 23 |
4.9% 17 |
| Isa Dix | 11.7% 525 |
62.1% 326 |
27.2% 143 |
34.9% 183 |
20.2% 106 |
10.7% 56 |
9.5% 50 |
8.8% 46 |
4.4% 23 |
4.4% 23 |
7.4% 39 |
5.7% 30 |
1.7% 9 |
| Clax Elem |
10.9% 493 |
62.5% 308 |
31.8% 157 |
30.6% 151 |
22.9% 113 |
11.4% 56 |
11.6% 57 |
5.9% 29 |
1.8% 9 |
4.1% 20 |
7.7% 38 |
3.2% 16 |
4.5% 22 |
| Jones Elem |
11.1% 501 |
62.5% 313 |
35.1% 176 |
27.3% 137 |
23.6% 118 |
10.6% 53 |
13% 65 |
5.6% 28 |
2.4% 12 |
3.2% 16 |
5.8% 29 |
2.6% 13 |
3.2% 16 |
| Vance Elem |
10.4% 470 |
61.5% 289 |
30.9% 145 |
30.6% 144 |
17.9% 84 |
11.1% 52 |
6.8% 32 |
12.3% 58 |
6% 28 |
6.4% 30 |
5.7% 27 |
2.8% 13 |
3% 14 |
Sources
- http://apps.schools.nc.gov/ords/f?p=145:15:::NO::
- Spreadsheet https://docs.google.com/spreadsheets/d/148iCtL6wxTBTZlRjITChUr6lZIbzT0VzKMVne7kX8vo/edit?usp=sharing
- Analysis performed by Ashley Cooper