Archives: Visualizations
We believe that interactive data has the power to engage the community and create positive change. Our goal is to bring research to the public in a way that can help people understand the numbers and make their own contributions.
Showing 99 visualizations of 99 total.
Paginated by 10.
Created
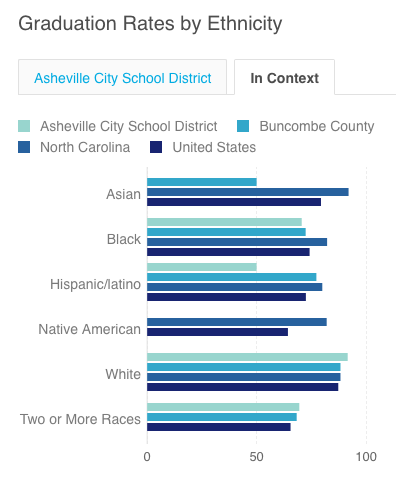
2016 Graduation rates by ethnicity — ACS, BCS, NC, US
2016 graduation rates by ethnicity for the Asheville City School District, Buncombe County School District, NC Schools, and United States.
Sources
- Schoolwires.net https://nc02214494.schoolwires.net/Page/380
Created
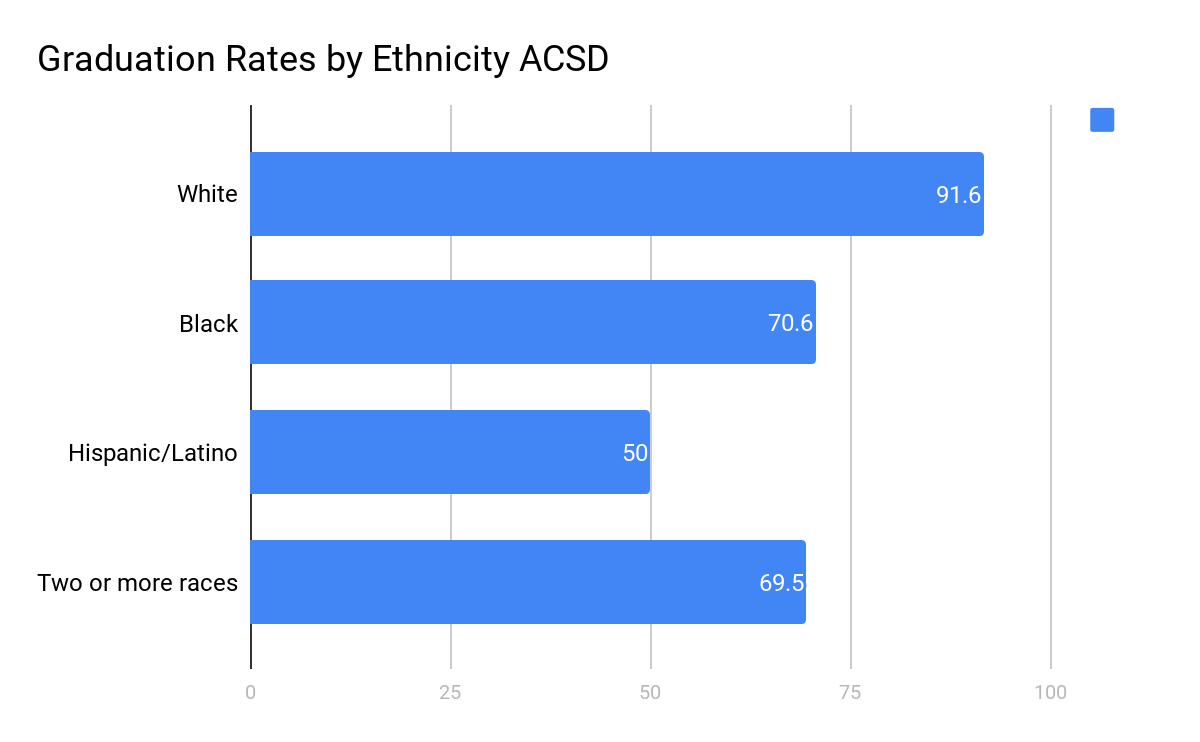
2016 Graduation rates by Ethnicity ACS
The 2016 Asheville City School graduation rate broken down by ethnicity.
Sources
- Schoolwires.net https://nc02214494.schoolwires.net/Page/380
Created
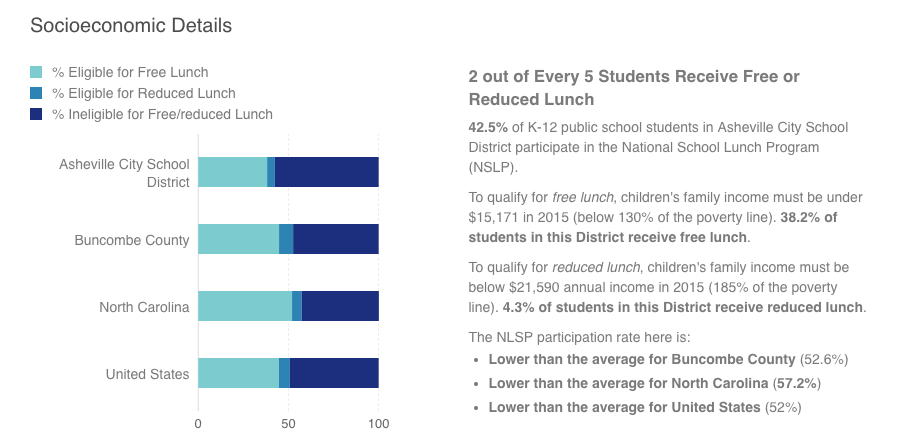
Reduced cost lunch & free lunch — socioeconomic details
Percentages of students receiving free lunch and reduced cost lunch.
Sources
- Schoolwires.net https://nc02214494.schoolwires.net/Page/380
Sources
This content needs a source. If you know where it came from and can provide further details, please help us source this content.
Sources
This content needs a source. If you know where it came from and can provide further details, please help us source this content.
Sources
- The North Carolina Department of Public Instruction http://www.ncpublicschools.org/accountability/reporting/leaperformancearchive/
Sources
- The North Carolina Department of Public Instruction http://www.ncpublicschools.org/accountability/reporting/leaperformancearchive/
Sources
- The North Carolina Department of Public Instruction http://www.ncpublicschools.org/accountability/reporting/leaperformancearchive
- Data Source Spreadsheet https://docs.google.com/spreadsheets/d/1_E6oD3N3C4v-P-z8ZQPCfd_J-WPqUIWwL1JB9Gn-Sww/edit#gid=417637011
Sources
- The North Carolina Department of Public Instruction http://www.ncpublicschools.org/accountability/reporting/leaperformancearchive/
